In the fundamental Analysis of stock, we need to check the financial health of the company for determining the intrinsic value of a share. If the market price of a share is below its intrinsic value, then it is an opportunity to buy otherwise check the next script. The fundamental analysis focuses on the business model, industry, revenue growth, margins, PBT, EPS, risk model, leverages, and financial stability of a company. Let’s discuss some terms which are of basic need for fundamental analysis: –
Market capitalisation
Market capitalisation is the market value of the total capital of a company. Market capitalisation can be arrived at by multiplying the outstanding number of shares of a company by its market price. For example, the automobile company, Ashok Leyland is having 2,93,55,27,276 outstanding shares, and the market price per share is Rs. 162.50 (as on 20.09.2022) Hence total market capitalisation of Ashok Leyland is Rs. 47702 crores. When share price changes, its market cap also changes. At present “Reliance Industries” is the largest Indian company by market capitalisation (Rs. 16.92 lakh crores as on 20.09.2022)
Free Flow Market capitalisation
Free flow market cap is the market value of those shares which are already available in the market for trading (buy & sell) by the public. Hence free flow market cap does not include the value of shares held by promoters. For example, The promoters of Ashok Leyland are holding 1,50,06,60,261shares out of total outstanding shares of 2,93,55,27,276. Hence the Market value of balance shares is around 23374 crores, which is the Free-flow market cap of this company and it changes with a change in share price. If promoters of a company sell some portion of their holding, then the free flow market cap increases. Before IPO (initial public offering), the free flow market cap remains zero, when IPO comes and promoters offload their holdings free flow market cap increases, which further increases with FPO (follow on public offerings).
EBITDA (Earning before interest, tax, depreciation, and amortization)
EBITDA is termed as the true measure of the profitability of a company because EBITDA is the profit calculated before the impact of—
- Interest i.e. financing decision (debt or equity)
- Depreciation
- Tax benefits or high tax rates.
- Any manipulative assumptions or amortizations.
- Other income if irregular or extraordinary.
EBITDA = PBT (net income) + interest + depreciation + amortisation
EBITDA = PAT + taxes + interest+ depreciation + amortisation
EBITDA = operating profit + depreciation (if deducted on factory machinery) + amortisation + other income (if regular)
If there is no other regular income and no factory depreciation or amortization, then operating profit is equal to EBITDA.
Operating Profits
Operating Profit is the profit from the regular business operations of a company before interest and depreciation. If there is no other regular income and no factory depreciation or amortization, then operating profit is equal to EBITDA.
Operating Margin % (OPM%)
Operating margin is the percentage of operating profit over sales. This show the profitability of a business. For example, if the Operating margin is 10% then it means, on sale of every 100 rupees, the company is earning Rs. 10. If the company reduces its sales prices, then its margin declines, sometimes company reduces its product prices to gain over competitors but if raw material prices are not controlled then margin declines. In such cases, we see that overall sales are increased but profits are not as increased as expected which happens due to lesser margins. But in long run, this turns beneficial when a competitor is out of the market then the company, hikes its product price then sales is not declined (as no choice left to the consumer), and margins are increased resulting in high profits for the company.
Book Value per share
Book value is the value that is left for the holder of each share if all liabilities of a company are paid back from all the assets of the company. In other words, book value is the worth of each share if all liabilities are disposed off from all the assets of a company.
Book value per share = (Total Assets – all outside liabilities) / no. of o/s shares
Book value per share = (share capital + reserves) / no of outstanding shares.
For example, as on march 2022, the share capital of Ashok Leyland is 294 crores and it has reserves of Rs. 7010 crores, total outstanding shares are 293.55 crores. Now book value per share is
Book value per shares = (294+7010) / 293.55 = Rs. 24.08 per shares.
Please note that book value is not the intrinsic value of shares, book value is calculated only on the basis of value reflected in the balance sheet. It does not take into account the market value and future earning potentials of assets available in the books of the company.
Return on Equity (ROE)
Return on equity (ROE) shows the percentage return for each penny invested by shareholders. ROE can be understood as net income as a percentage of average equity.
ROE can be calculated as –
ROE = Net income / average Equity & Reserves
ROE = Net Income / (Total assets – outside liability)
ROE = Net income / Net assets
Hence ROE can also be termed as a return on net assets. ROE shows how efficiently the owner’s fund is utilized and how much each penny (invested by owner/shareholder) is earning.
Return on Capital Employed (ROCE)
ROCE shows how each penny invested in the company (by owner or lender) is utilized and how much it is earning. ROCE takes into account the total capital employed. ROCE can be calculated as
ROCE = Earning before interest & tax / capital employed
ROCE = Earning before interest & tax / (Total assets – current liabilities)
ROCE = (PAT + interest + taxes) / (equity+ reserves + long terms liabilities)
PE Ratio (Price-Earing) Ratio
PE Ratio shows the ratio between the market price of a share and earnings per share. PE ratio is arrived at by diving the market price by EPS. For example, as on March 2022, EPS (earning per share) of Reliance industries is Rs. 89.74 and if the market price of reliance is Rs. 2500 then PE ratio would be 2500/89.74 i.e. 27.8.
PE Ratio = market price / EPS
PE Ratio = Market price per share / (net income / no of o/s shares)
To clarify let’s take one more example, if EPS of a company is 10 and the market price per share is 250 then PE ratio is 250/10 i.e. 25.
It shows that a share of Rs. 250 is earning Rs. 10 for the company which is only 4%. But this should not be taken as 4% because the company is earning this Rs. 10 not from 250 but from the issue price of the share which is shown as capital in the books of the company. The market price of a share does not get invested in the business of a company but it goes into the pocket of the seller who may be bought this share at an issue price or lesser market price. Now the concept is that it cannot be understood that high PE is bad or lower PE is good. As PE also reflects the future expectations of the investors. Hence we may compare PE of companies in the same industry with Industry PE but it may not be compared between companies of different industries.
Dividend Yield
Dividend yield can be understood as a percentage return by a company in the form of a dividend. For example, the Market price of a share if Rs. 100, and the company paid a dividend of rs. 10 per share then the divided yield is 10%.
Dividend Yield = Cash dividend per share X 100 / market price per share.
In the above example, if I had bought that share for Rs. 80 and the market price now is 100 and the company paid a dividend of Rs. 10 then also the dividend yield is 10% but my return is 12.5%.
CAGR (Compound Annual Growth Rate)
CAGR is the rate of return given by an investment over many years if compounded annually. For example, If I Invested Rs. 100 and received Rs. 121 at the end of two years. Then My CAGR would be 10%.

CAGR = (Final value / starting value)^1/t – 1
Expected Return by CAPM (Capital assets pricing model)
The expected return is the minimum return that should be given by an investment considering the underlying risk factors. We know that there are risk-free returns (like bank FD, Govt securities, etc) that can be earned without taking any risk. But still, if someone is putting his money in some risky investment then a premium over a risk-free return is expected.

Expected Return = Risk free return + beta of security(Risk premium)
Expected Return = Risk-free return + Beta of the transaction (Market return – Risk-free return)
If the actual return is more than the expected return then it is called an Alpha return.
Alpha = Actual return – expected return as above.
Beta = Covariance of script return with market return / Variance of the market return.
IRR (Internal Rate of Return)
IRR i.e. Internal rate of return is that rate which is inherent in a project, It means the available rate of return of a project. In other words, IRR is the return that we earn if we take a project. IRR shows the profitability of a proposal.
At IRR IF IRR is not less than our required rate of return then the investment proposal is accepted but if IRR is less than our required rate of return the proposal is rejected. For example, if our required rate of return is 15%. And we received an investment proposal for the investment of Rs. 100 for one year and after one year we are expected to receive Rs. 110. Then IRR is 10% but the required rate is 15%. Hence proposal is rejected.
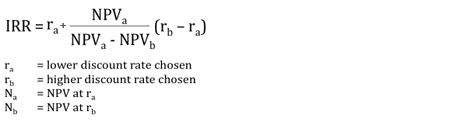
But for a proposal having a time period of more than one year, the calculation of IRR is more complex. If IRR is used as a discounting rate then it equals future can inflows and outflows. Hence IF IRR (internal rate of return) is used as discounting factor then NPV will be zero.
Hence to find IRR of a proposal we need to calculate NPV at two different discounting rate then IRR can be calculated using the following formula.
NPV (Net present value)
NPV, Net present value is the difference between the present values of all future cash inflows and outflows.
NPV = (present value all future cash inflows)- (Present value of cash outflows)
The present values of future cash flows is calculated using a discounting rate. IF IRR (internal rate of return) is used as discounting factor then NPV will be zero.

Discount Rate (Discounting factor)
The discount rate or discounting factor is the rate used for discounting future cash flows to arrive at present value. For example, A sum of Rs. 120 will be received after one year then to calculate the present value of this we use the formula:-
Present value = Future value / (1+rate)^t
If the discount rate is 10% then the present value of 120 comes to Rs. 109.09
If the discount rate is 20% then the present value of 120 comes to Rs. 100.
Hence discount rate is the rate at which the present value of an investment equals its future value. For different purposes, we may use different discounting rates like Risk-free rate, WACC, expected return rate, or required rate of return.
Intrinsic value
Intrinsic value is treated as the true value of a share. The intrinsic value of a share can be arrived at by summing up the present value of all expected future cash flows. To calculate the present value, we need a discounting rate, we recommend using risk-free return, but some prefer to use WACC.
Hence Intrinsic value is the present value of all future cash flows from a share. The intrinsic value of a business is divided by the number of shares to arrive at an intrinsic value per share. Intrinsic value for a business can be arrived at using following formula: –
